Anomalies and the Anomaly Dashboard
Anomalies are unusual events in your site's data. Yottaa tracks your site's performance over a two-week period and identifies any spikes or plunges in the site data using machine learning.
Anomalies are not necessarily bad. For example, a spike in traffic might trigger an anomaly. However, the root cause could be something positive, like a successful marketing campaign. Or it could be something negative like malicious bots. Monitor the Anomaly dashboard or set up anomaly detection to stay updated on anomalies and investigate them further.
The Anomaly Dashboard
You can access the Anomaly Dashboard in the Yottaa portal by clicking Dashboards > Anomaly.
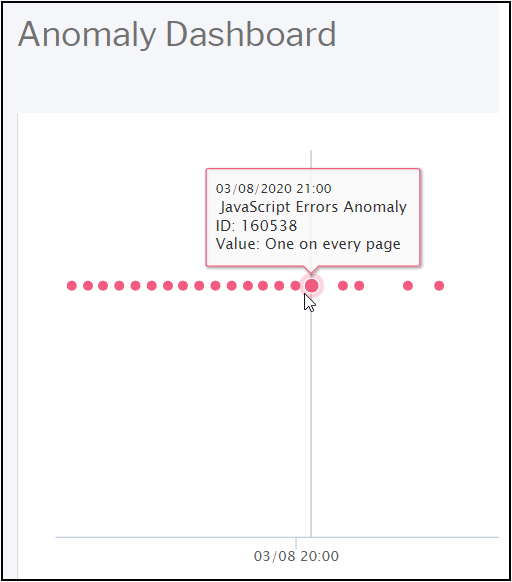
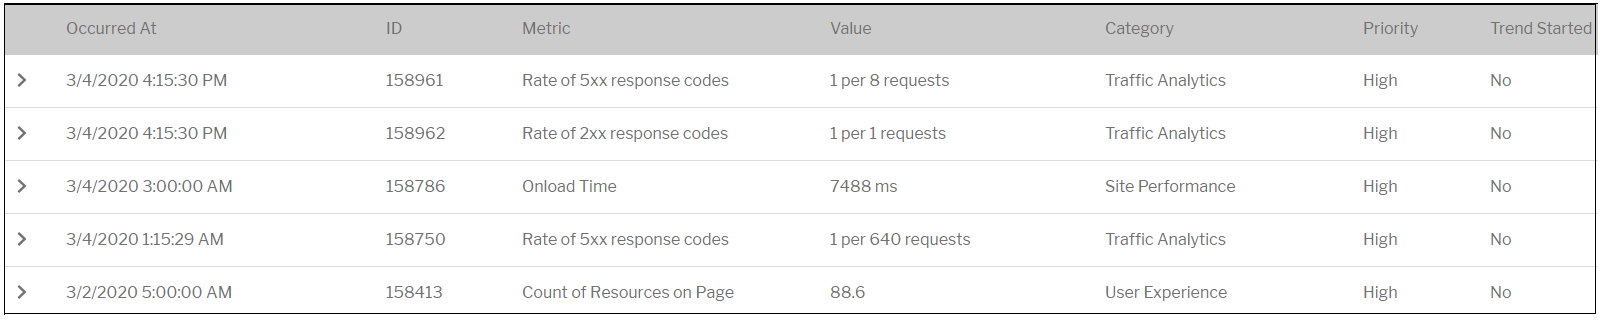
The anomaly dashboard displays anomalies for the past five days. The anomalies appear as points on a graph, as well as in a list. For more details about each anomaly, click the arrow on the left of the list item.
|
|
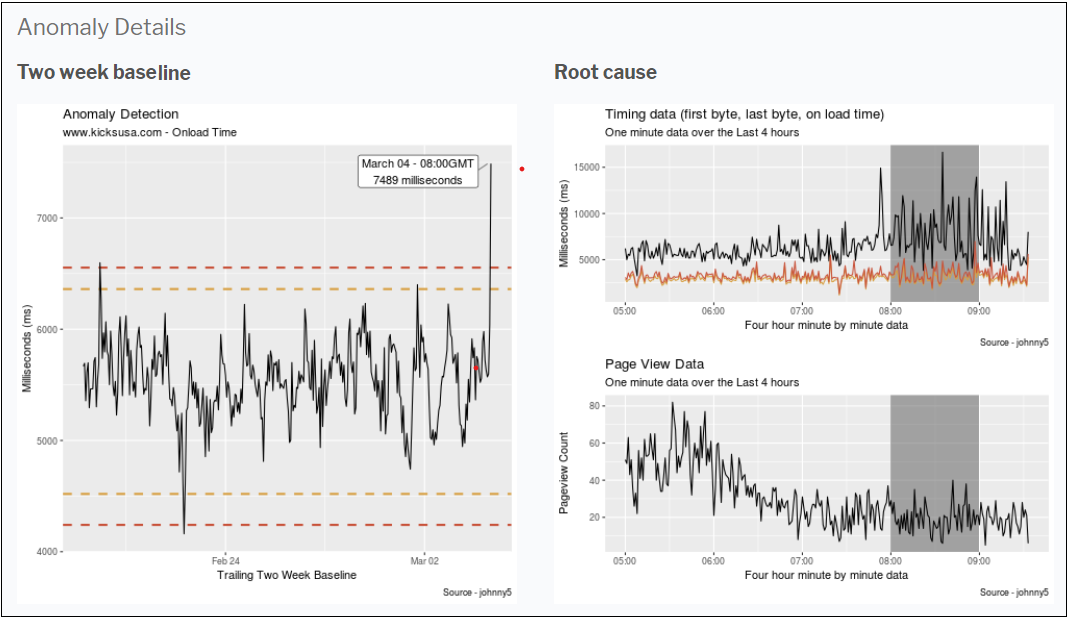
The details show:
|
Two-Week Baseline graph |
Displays the anomaly metric for the two weeks leading up to the anomaly. The orange lines show the threshold for a medium-priority anomaly, and the red lines show the threshold for high-priority anomalies. Use this graph to determine the seriousness of the anomaly -- Was it simply an aberration or was the anomaly sustained over time? Does it cross the red high-priority threshold? These are all questions to ask yourself as you evaluate further action. |
|
Contributing Factors graphs |
On the right, one or two graphs display potential root causes of the anomaly. The top graph shows other metrics within the same category. The bottom graph usually shows page views. Each displays minute-by-minute values for the four-hour period leading up to the anomaly. The gray bar highlights the metrics that happened at the same time as the anomaly. In the example below, since page views did not go up during the anomaly, it is likely unrelated to customer traffic. In this case, the user would have to do further research using the Performance Inventory page and other dashboards to figure out what is causing the anomaly.
|
|
Triggering Requests |
This information displays for JavaScript Errors. It shows the country, region, devices, and IP addresses of the requests that triggered the anomaly. You can use this information to identify any problems with URLs that may be causing JavaScript errors. |
Interpreting Anomalies
Anomalies that have to do with load time, page views, and WAF data might point to infrastructure failures, code failures that cause errors, or traffic issues. If these anomalies spike once and then disappear, they are not a big concern. The code causing an error may have automatically rebooted, or a user may have done something malicious and then given up. If you have Service Blocker, an anomaly can mean that a new service is accessing, or attempting to access, your site.
The biggest concern for the health of your website are ongoing anomalies. These should be given the highest priority.